MINISTRY OF COMMERCE
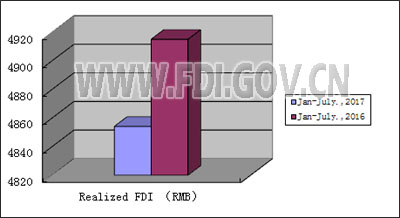
According to statistics of the foreign direct investment in China, from January to July 2017, the Newly Approved Foreign-invested Enterprises amounted to 17,703, up by 12% year on year; and the actual use of foreign investment reached RMB 485.42b, down by 1.2% year on year ( USD 72.14b, down by 6.5% year on year).
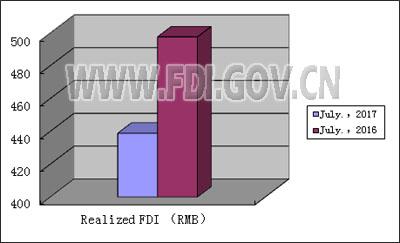
According to the statistics of foreign direct investment, in July 2017, the Newly Approved Foreign-invested Enterprises amounted to 2,650, up by 10.1% year on year; and the actual use of foreign investment reached RMB 43.89 billion, down by 11.8% year on year (USD 6.5billion, down by 15.8% year on year).
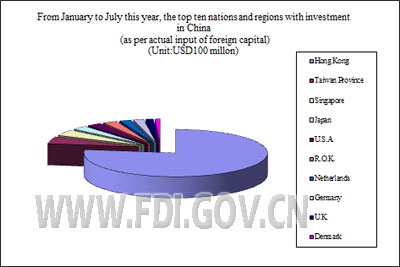
From January to July this year, the top ten nations and regions regarding investment in China (according to the actual input of foreign capital) are as follows: Hong Kong (USD52.57b), Taiwan Province (USD3.26b), Singapore (USD2.81b), Japan (USD1.84b), U.S.A. (USD1.78b), R.O.K.(USD1.75b), Netherlands (USD1.36b), Germany (USD1.24b) , U.K. (USD890m) and Denmark (USD610m), total of which accounted to USD68.1b, accounting for 94.4% of total actual use of foreign investment in the country, down by 6.7% year on year.