 MINISTRY OF COMMERCE
Statistics of FDI in January-May 2012
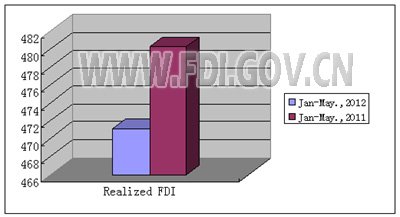
According to the statistics of news release of foreign investment, from January to May 2012, Newly Approved Foreign-invested Enterprises amounted to 9,261, down by 12.16% year on year; and the actual use of foreign investment reached US$ 47.11billion, down by 1.91% year on year.
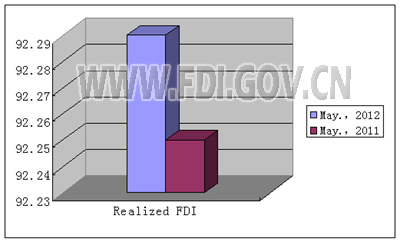
According to the statistics of news release of foreign investment, in May 2012, Newly Approved Foreign-invested Enterprises amounted to 2245, down by 6.11% year on year; and the actual use of foreign investment reached US$ 9.229 billion, up by 0.05% year on year.
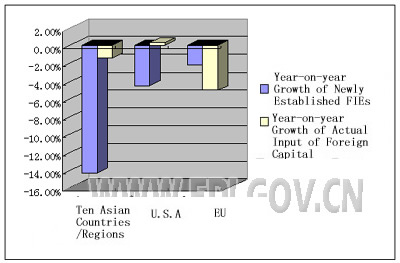
In January-May, 2012, the number of newly established enterprises funded by ten Asian countries/regions (Hong Kong, Macao, Taiwan, Japan, the Philippines, Thailand, Malaysia, Singapore, Indonesia, ROK) was 7,204, down by 14.33% year on year, and the actual input were US$40.656 billion, down by 1.41% year on year. The number of newly established enterprises funded by US was 571, down by 4.52% year on year, and the actual input were US$1.289 billion, up by 0.29% year on year. Number of enterprises funded by EU was 685, down by 2.14% year on year, and the actual input was US$2.781 billion, down by 5.06% year on year.
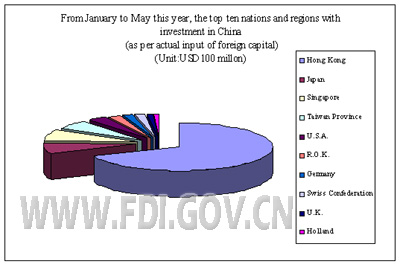
From January to May this year, the top ten nations and regions with investment in China (as per the actual input of foreign capital) are as follows: Hong Kong (US$29.935 billion), Japan (US$3.22 billion), Singapore (US$3.146 billion), Taiwan Province(US$2.834 billion), U.S.A. (US$1.289 billion), R.O.K.(US$945 million), Germany (US$775 million), Swiss Confederation (US$688 million), U.K.(US$450 million) and Holland (US$416 million), total of which accounted for 92.76% of total actual use of foreign investment in the country.
Note: The figures cover investment in China by the said countries/regions transferred from free ports of Virgin Islands, Cayman Islands, Samoa, Mauritius and Barbados.
All information published in this website is authentic in Chinese. English is provided for reference only.
According to the statistics of news release of foreign investment, in May 2012, Newly Approved Foreign-invested Enterprises amounted to 2245, down by 6.11% year on year; and the actual use of foreign investment reached US$ 9.229 billion, up by 0.05% year on year.
In January-May, 2012, the number of newly established enterprises funded by ten Asian countries/regions (Hong Kong, Macao, Taiwan, Japan, the Philippines, Thailand, Malaysia, Singapore, Indonesia, ROK) was 7,204, down by 14.33% year on year, and the actual input were US$40.656 billion, down by 1.41% year on year. The number of newly established enterprises funded by US was 571, down by 4.52% year on year, and the actual input were US$1.289 billion, up by 0.29% year on year. Number of enterprises funded by EU was 685, down by 2.14% year on year, and the actual input was US$2.781 billion, down by 5.06% year on year.
From January to May this year, the top ten nations and regions with investment in China (as per the actual input of foreign capital) are as follows: Hong Kong (US$29.935 billion), Japan (US$3.22 billion), Singapore (US$3.146 billion), Taiwan Province(US$2.834 billion), U.S.A. (US$1.289 billion), R.O.K.(US$945 million), Germany (US$775 million), Swiss Confederation (US$688 million), U.K.(US$450 million) and Holland (US$416 million), total of which accounted for 92.76% of total actual use of foreign investment in the country.
Note: The figures cover investment in China by the said countries/regions transferred from free ports of Virgin Islands, Cayman Islands, Samoa, Mauritius and Barbados.
All information published in this website is authentic in Chinese. English is provided for reference only.