 MINISTRY OF COMMERCE
Statistics of FDI in January-March 2012
According to statistics carried by Foreign Investment Bulletin, in January-March, 2012, the number of newly approved foreign-funded enterprises in China totaled 5,379, down by 9.4% year on year; and actually utilized foreign investment reached US$29.48 billion, down by 2.83% year on year.
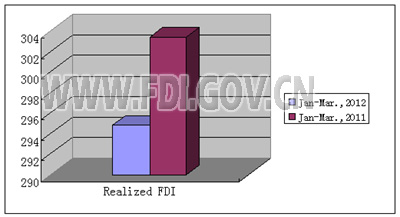
In March, the number of newly approved foreign-funded enterprises in China reached 2,374, down by 6.46% year on year; and actually utilized foreign investment totaled US$11.757 billion, down by 6.07% year on year.
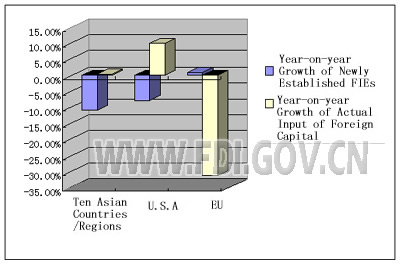
In January-March, 2012, the number of newly established enterprises funded by ten Asian countries/regions (Hong Kong, Macao, Taiwan, Japan, the Philippines, Thailand, Malaysia, Singapore, Indonesia, ROK) was 4,206, down by 10.83% year on year, and the actual input were US$25.882 billion, up by 0.37% year on year. The number of newly established enterprises funded by US was 322, down by 7.74% year on year, and the actual input were US$0.893 billion, up by 10.08% year on year. Number of enterprises funded by EU was 413, up by 0.98% year on year, and the actual input was US$1.414 billion, down by 31.24% year on year.
In January-March, 2012, top ten countries/regions in terms of actually input were: Hong Kong (US $19.271 billion), Japan (US $2.073 billion), Taiwan (US $1.954 billion), Singapore (US $1.687 billion), USA (US $0.893 billion), ROK (US $0.549 billion), Switzerland (US $0.368 billion), UK (US $0.327 billion), Germany (US $0.297 billion), and Holland (US $0.215 billion). The actual input by the top ten accounted for 93.74% of total actually utilized foreign capital.
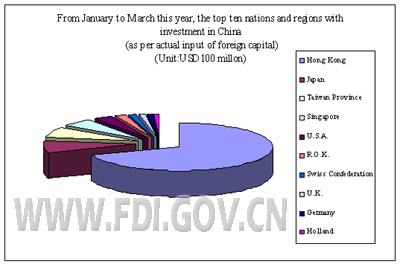
Note: The figures cover investment in China by the said countries/regions transferred from free ports of Virgin Islands, Cayman Islands, Samoa, Mauritius and Barbados.
All information published in this website is authentic in Chinese. English is provided for reference only.
In March, the number of newly approved foreign-funded enterprises in China reached 2,374, down by 6.46% year on year; and actually utilized foreign investment totaled US$11.757 billion, down by 6.07% year on year.
In January-March, 2012, the number of newly established enterprises funded by ten Asian countries/regions (Hong Kong, Macao, Taiwan, Japan, the Philippines, Thailand, Malaysia, Singapore, Indonesia, ROK) was 4,206, down by 10.83% year on year, and the actual input were US$25.882 billion, up by 0.37% year on year. The number of newly established enterprises funded by US was 322, down by 7.74% year on year, and the actual input were US$0.893 billion, up by 10.08% year on year. Number of enterprises funded by EU was 413, up by 0.98% year on year, and the actual input was US$1.414 billion, down by 31.24% year on year.
In January-March, 2012, top ten countries/regions in terms of actually input were: Hong Kong (US $19.271 billion), Japan (US $2.073 billion), Taiwan (US $1.954 billion), Singapore (US $1.687 billion), USA (US $0.893 billion), ROK (US $0.549 billion), Switzerland (US $0.368 billion), UK (US $0.327 billion), Germany (US $0.297 billion), and Holland (US $0.215 billion). The actual input by the top ten accounted for 93.74% of total actually utilized foreign capital.
Note: The figures cover investment in China by the said countries/regions transferred from free ports of Virgin Islands, Cayman Islands, Samoa, Mauritius and Barbados.
All information published in this website is authentic in Chinese. English is provided for reference only.