 MINISTRY OF COMMERCE
Statistics of FDI in January-April 2012
According to statistics by Foreign Investment Bulletin, in January-April, 2012, the number of newly approved foreign-funded enterprises in China totaled 7,016, down by 13.94% year on year; and actually utilized foreign investment reached US$37.881 billion, down by 2.38% year on year.

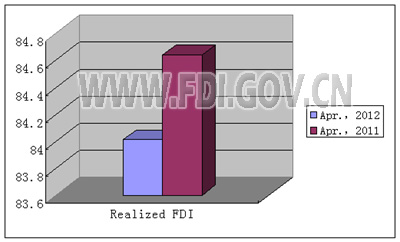
In April, the number of newly approved foreign-funded enterprises in China reached 1,637, down by 26.09% year on year; and actually utilized foreign investment totaled US$8.401 billion, down by 0.74% year on year.
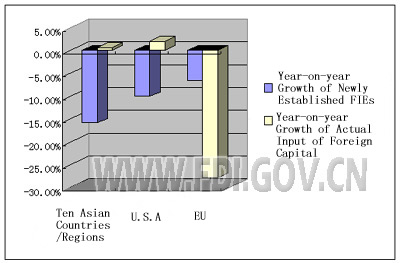
In January-April, 2012, the number of newly established enterprises funded by ten Asian countries/regions (Hong Kong, Macao, Taiwan, Japan, the Philippines, Thailand, Malaysia, Singapore, Indonesia, ROK) was 5,460, down by 15.83% year on year, and the actual input were US$33.076 billion, up by 0.6% year on year. The number of newly established enterprises funded by US was 427, down by 10.11% year on year, and the actual input were US$1.047 billion, up by 1.89% year on year. Number of enterprises funded by EU was 525, down by 6.58% year on year, and the actual input was US$1.902 billion, down by 27.92% year on year.
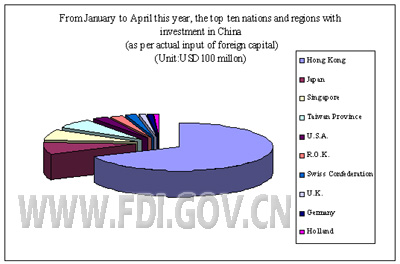
In January-April, 2012, top ten countries/regions in terms of actually input were: Hong Kong (US $24.164 billion), Japan (US $2.695 billion), Singapore (US $2.569 billion), Taiwan (US $2.345 billion), USA (US $1.047 billion), ROK (US $0.804 billion), Switzerland (US $0.623 billion), UK (US $0.4 billion), Germany (US $0.369 billion), and Holland (US $0.327 billion). The actual input by the top ten accounted for 93.3% of total actually utilized foreign capital.
Note: The figures cover investment in China by the said countries/regions transferred from free ports of Virgin Islands, Cayman Islands, Samoa, Mauritius and Barbados.
All information published in this website is authentic in Chinese. English is provided for reference only.
In April, the number of newly approved foreign-funded enterprises in China reached 1,637, down by 26.09% year on year; and actually utilized foreign investment totaled US$8.401 billion, down by 0.74% year on year.
In January-April, 2012, the number of newly established enterprises funded by ten Asian countries/regions (Hong Kong, Macao, Taiwan, Japan, the Philippines, Thailand, Malaysia, Singapore, Indonesia, ROK) was 5,460, down by 15.83% year on year, and the actual input were US$33.076 billion, up by 0.6% year on year. The number of newly established enterprises funded by US was 427, down by 10.11% year on year, and the actual input were US$1.047 billion, up by 1.89% year on year. Number of enterprises funded by EU was 525, down by 6.58% year on year, and the actual input was US$1.902 billion, down by 27.92% year on year.
In January-April, 2012, top ten countries/regions in terms of actually input were: Hong Kong (US $24.164 billion), Japan (US $2.695 billion), Singapore (US $2.569 billion), Taiwan (US $2.345 billion), USA (US $1.047 billion), ROK (US $0.804 billion), Switzerland (US $0.623 billion), UK (US $0.4 billion), Germany (US $0.369 billion), and Holland (US $0.327 billion). The actual input by the top ten accounted for 93.3% of total actually utilized foreign capital.
Note: The figures cover investment in China by the said countries/regions transferred from free ports of Virgin Islands, Cayman Islands, Samoa, Mauritius and Barbados.
All information published in this website is authentic in Chinese. English is provided for reference only.