 MINISTRY OF COMMERCE
Statistics of January 2012 on National Absorption of FDI
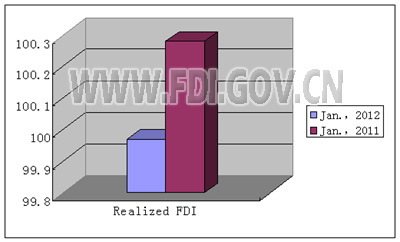
According to Foreign Investment Bulletin, in January, the number of newly approved foreign-funded enterprises in China reached 1,402, down by 37.49% year on year; and actually used foreign investment totaled US$9.997 billion, down by 0.3% year on year.
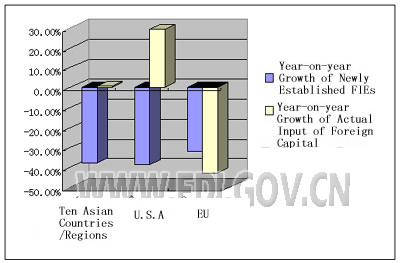
During the same period, the number of newly established enterprises funded by ten Asian countries/regions (Hong Kong, Macao, Taiwan, Japan, Philippines, Thailand, Malaysia, Singapore, Indonesia, ROK) are 1,105, down by 37.82% year on year, and the actual input are US$8.586 billion, up by 0.77% year on year. The number of newly established enterprises funded by US are 86, down by 38.57% year on year, and the actual input are US$0.342 billion, up by 29.05% year on year. Enterprises funded by EU are 107, down by 32.28% year on year, and the actual input is US$0.452 billion, down by 42.49% year on year.
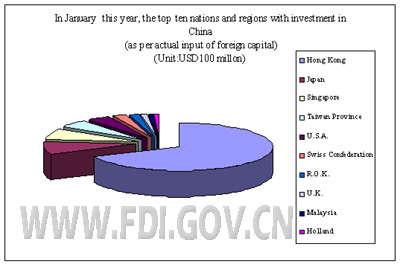
In January, 2012, top ten countries/regions in terms of actually utilized value of foreign capital are: Hong Kong (US $6.357 billion), Japan (US $0.799 billion), Singapore (US $0.646 billion), Taiwan (US $0.49 billion),USA (US $0.342 billion), Switzerland (US $0.25 billion), ROK (US $0.159 billion), UK (US $93 million), Malaysia (US $83 million), and Netherlands (US $73 million). The actual use of foreign capital of from the top ten accounts for 92.95% of total actually used foreign capital.
Note: The figures cover investment in China by the said countries/regions through free ports of Virgin Islands, Cayman Islands, Samoa, Mauritius and Barbados.
All information published in this website is authentic in Chinese. English is provided for reference only.
During the same period, the number of newly established enterprises funded by ten Asian countries/regions (Hong Kong, Macao, Taiwan, Japan, Philippines, Thailand, Malaysia, Singapore, Indonesia, ROK) are 1,105, down by 37.82% year on year, and the actual input are US$8.586 billion, up by 0.77% year on year. The number of newly established enterprises funded by US are 86, down by 38.57% year on year, and the actual input are US$0.342 billion, up by 29.05% year on year. Enterprises funded by EU are 107, down by 32.28% year on year, and the actual input is US$0.452 billion, down by 42.49% year on year.
In January, 2012, top ten countries/regions in terms of actually utilized value of foreign capital are: Hong Kong (US $6.357 billion), Japan (US $0.799 billion), Singapore (US $0.646 billion), Taiwan (US $0.49 billion),USA (US $0.342 billion), Switzerland (US $0.25 billion), ROK (US $0.159 billion), UK (US $93 million), Malaysia (US $83 million), and Netherlands (US $73 million). The actual use of foreign capital of from the top ten accounts for 92.95% of total actually used foreign capital.
Note: The figures cover investment in China by the said countries/regions through free ports of Virgin Islands, Cayman Islands, Samoa, Mauritius and Barbados.
All information published in this website is authentic in Chinese. English is provided for reference only.