 MINISTRY OF COMMERCE
Statistics of FDI in January-September 2012
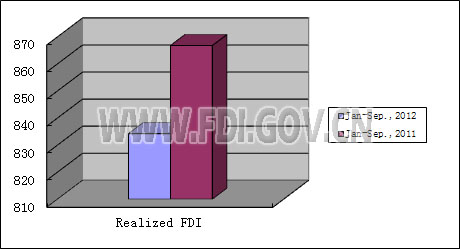
According to the statistics of news release of foreign investment, from January to September 2012, Newly Approved Foreign-invested Enterprises amounted to 18,025, down by 11.67% year on year; and the actual use of foreign investment reached US$83.423 billion, down by 3.76% year on year.
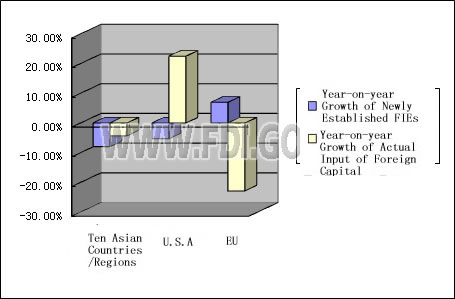
In January-September, 2012, the number of newly established enterprises funded by ten Asian countries/regions (Hong Kong, Macao, Taiwan, Japan, the Philippines, Thailand, Malaysia, Singapore, Indonesia, ROK) was 14,251, down by 13.49% year on year, and the actual input were US$70.987 billion, down by 4.93% year on year. The number of newly established enterprises funded by US was 1,023, down by 6.92% year on year, and the actual input were US$2.371 billion, down by 0.63% year on year. Number of enterprises funded by EU was 1,279, up by 1.43% year on year, and the actual input was US$4.831 billion, down by 6.25% year on year.
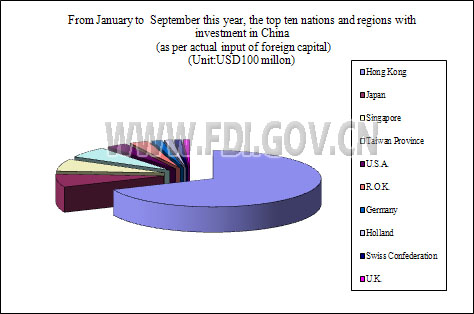
From January to September this year, the top ten nations and regions with investment in China (as per the actual input of foreign capital) are as follows: Hong Kong (US$52.084 billion), Japan (US$5.621 billion), Singapore (US$5.242 billion), Taiwan Province (US$4.802 billion), U.S.A. (US$2.371 billion), R.O.K. (US$2.179 billion), Germany (US$1.192 billion), Holland (US$905 million) , Swiss Confederation (US$804 million), and U.K. (US$745 million), total of which accounted for 91.04% of total actual use of foreign investment in the country.
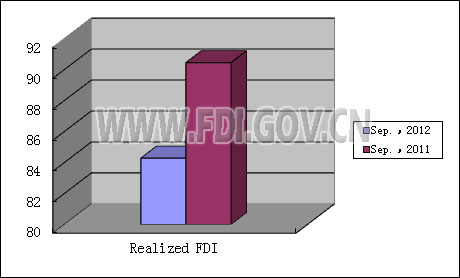
According to the statistics of news release of foreign investment, in September 2012, Newly Approved Foreign-invested Enterprises amounted to 2,248, down by 6.37% year on year; and the actual use of foreign investment reached US$8.328 billion, down by 6.81% year on year.
In September, 2012, the number of newly established enterprises funded by ten Asian countries/regions (Hong Kong, Macao, Taiwan, Japan, the Philippines, Thailand, Malaysia, Singapore, Indonesia, ROK) was 1,820, down by 7.94% year on year, and the actual input were US$7.364 billion, down by 4.31% year on year. The number of newly established enterprises funded by US was 125, down by 5.3% year on year, and the actual input were US$0.256 billion, up by 22.47% year on year. Number of enterprises funded by EU was 138, up by 6.98% year on year, and the actual input was US$0.456 billion, down by 22.85% year on year.
Note: The figures cover investment in China by the said countries/regions transferred from free ports of Virgin Islands, Cayman Islands, Samoa, Mauritius and Barbados.
All information published in this website is authentic in Chinese. English is provided for reference only.
In January-September, 2012, the number of newly established enterprises funded by ten Asian countries/regions (Hong Kong, Macao, Taiwan, Japan, the Philippines, Thailand, Malaysia, Singapore, Indonesia, ROK) was 14,251, down by 13.49% year on year, and the actual input were US$70.987 billion, down by 4.93% year on year. The number of newly established enterprises funded by US was 1,023, down by 6.92% year on year, and the actual input were US$2.371 billion, down by 0.63% year on year. Number of enterprises funded by EU was 1,279, up by 1.43% year on year, and the actual input was US$4.831 billion, down by 6.25% year on year.
From January to September this year, the top ten nations and regions with investment in China (as per the actual input of foreign capital) are as follows: Hong Kong (US$52.084 billion), Japan (US$5.621 billion), Singapore (US$5.242 billion), Taiwan Province (US$4.802 billion), U.S.A. (US$2.371 billion), R.O.K. (US$2.179 billion), Germany (US$1.192 billion), Holland (US$905 million) , Swiss Confederation (US$804 million), and U.K. (US$745 million), total of which accounted for 91.04% of total actual use of foreign investment in the country.
According to the statistics of news release of foreign investment, in September 2012, Newly Approved Foreign-invested Enterprises amounted to 2,248, down by 6.37% year on year; and the actual use of foreign investment reached US$8.328 billion, down by 6.81% year on year.
In September, 2012, the number of newly established enterprises funded by ten Asian countries/regions (Hong Kong, Macao, Taiwan, Japan, the Philippines, Thailand, Malaysia, Singapore, Indonesia, ROK) was 1,820, down by 7.94% year on year, and the actual input were US$7.364 billion, down by 4.31% year on year. The number of newly established enterprises funded by US was 125, down by 5.3% year on year, and the actual input were US$0.256 billion, up by 22.47% year on year. Number of enterprises funded by EU was 138, up by 6.98% year on year, and the actual input was US$0.456 billion, down by 22.85% year on year.
Note: The figures cover investment in China by the said countries/regions transferred from free ports of Virgin Islands, Cayman Islands, Samoa, Mauritius and Barbados.
All information published in this website is authentic in Chinese. English is provided for reference only.